Learning D3 Part 4: Intro to SVG Graphics
In Learning D3 Part 3, I went over how to add some basic animation and interactivity. This time I’ll go over a big component of D3 and other javascript visualization tools – SVG or Scalable Vector Graphics.
Scalable Vector Graphics
SVG is an XML based, 2 dimensional open-standard that’s been around since 1999. Since SVG graphics are vector based, they can be zoomed or scaled to any resolution without quality loss.
What can you do with it? SVG has a lot of functionality: paths, basic shapes, vertical text, text on a curve, gradient fills, masks, etc.
Canvas
Another tool for adding visuals to the web is the recently added HTML5 Canvas element. SVG and Canvas are not the same thing. Whereas SVG is vector based, Canvas uses raster graphics. SVG elements remain live and addressable in a scene graph (the DOM) after they’ve been rendered to the screen, so you can update them after rendering. Canvas uses a procedural approach – rather than declaring elements with XML, commands are only executed via scripts. In canvas, once an object has been drawn to the screen, it’s forgotten. If you need to move that object, you need to re-render the entire scene.
SVG in D3
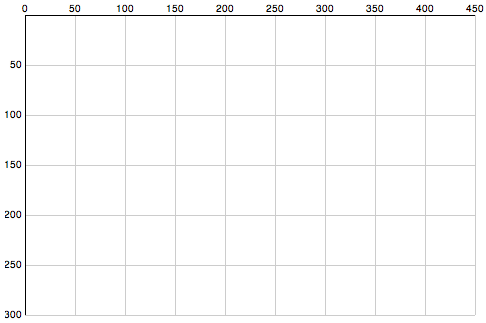
So to get started – we need to learn some more basics of SVG. The axis starts in the top left corner of a root SVG element and counts up as you move down and towards the right. If you have a 500×500 region, the point [0,0] is in the upper left, and [500,500] is in the bottom right.
Here’s a chart to illustrate SVG’s coordinate space, followed by the code to draw the chart.
Now the code:
// Define linear scales representing the pixel dimensions
var x = d3.scale.linear()
    .domain([0, 450])
    .range([0, 450]);

var y = d3.scale.linear()
     .domain([0,300])
     .range([0, 300]);

// define an SVG element to hold our chart
var chart = d3.select("body").append("svg")
    .attr("class", "chart")
    .attr("width", 490) // more space to accomodate our axis labels
    .attr("height", 320) // moar space!
  .append("g")
    .attr("transform", "translate(20,15)"); // move base coordinates over/down a bit so lines start at 0,0

// draw the X grid lines
chart.selectAll("line.x")
    .data(x.ticks(10))
  .enter().append("line")
    .attr("class", "x")
    .attr("x1", x)
    .attr("x2", x)
    .attr("y1", 0)
    .attr("y2", 300)
    .style("stroke", "#ccc");

// draw the Y axis grid lines
chart.selectAll("line.y")
    .data(y.ticks(10))
  .enter().append("line")
    .attr("class", "y")
    .attr("x1", 0)
    .attr("x2", 450)
    .attr("y1", y)
    .attr("y2", y)
    .style("stroke", "#ccc");

// add the X axis labels
chart.selectAll(".rule")
    .data(x.ticks(10))
  .enter().append("text")
    .attr("x", x)
    .attr("y", 0)
    .attr("dy", -3)
    .attr("text-anchor", "middle")
    .text(String);

// add the Y axis labels
chart.selectAll(".rule")
    .data(y.ticks(10))
  .enter().append("text")
    .attr("x", 0)
    .attr("y", y)
    .attr("dy", 3) // shift down slightly
    .attr("dx", -3)  // and to the left
    .attr("text-anchor", "end") // align right
    .text(function(d) { return d == 0 ? '' : d;});

// add the darker X axis line
chart.append("line")
    .attr("x1", 0)
    .attr("x2", 450)
    .style("stroke", "#000");

// add the darker Y axis line
chart.append("line")
    .attr("y1", 0)
    .attr("y2", 300)
    .style("stroke", "#000");
That’s a bit long, eh? Here is the whole example. D3 actually has more convenient functions for drawing axis lines, I’ll leave those for another time. That’s all for tonight!
Continue with the D3 Series:
- Learning D3 Part 1: Selections, Properties, Data
- Learning D3 Part 2: Enter and Exit
- Learning D3 Part 3: Animation & Interaction
- Learning D3 Part 4: Intro to SVG Graphics
- Learning D3 Part 5: Axes
- Learning D3 Part 6: Scales & Colors
- Learning D3 Part 7: Choropleth Maps
