Learning D3 Part 5: Axes
In Learning D3 Part 4, I briefly introduced SVG, the differences between SVG and Canvas, and drew a chart grid to illustrate how SVG’s canvas goes from top/left to bottom/right.
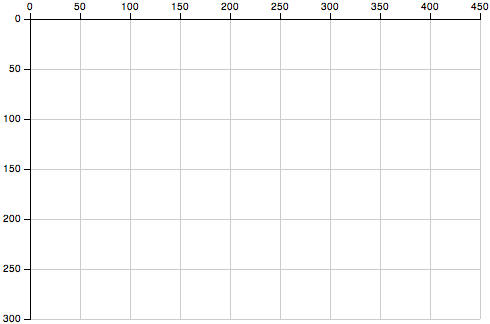
D3 has a nice axis component for drawing reference lines, tick marks, and labels, which cleans up some of the code from the previous example. Here’s another good tutorial on it. Here’s the previous example, now drawn using d3.axis.
This example also contains tick marks as part of the axis lines. Might be unnecessary chart-junk depending on the situation, but they’re easily removed if you don’t need them.
Code:
// Define identity (1:1) scales
var x = d3.scale.identity().domain([0,450]);
var y = d3.scale.identity().domain([0,300]);

// Define container
var chart = d3.select("body")
  .append("svg")
    .attr("class", "chart")
    .attr("width", 490)
    .attr("height", 330)
    .append("g")
      // move 0,0 slightly down and right to accomodate axes
     .attr("transform", "translate(30,20)");

// Draw X-axis grid lines
chart.selectAll("line.x")
  .data(x.ticks(10))
  .enter().append("line")
  .attr("class", "x")
  .attr("x1", x)
  .attr("x2", x)
  .attr("y1", 0)
  .attr("y2", 300)
  .style("stroke", "#ccc");

// Draw Y-axis grid lines
chart.selectAll("line.y")
  .data(y.ticks(10))
  .enter().append("line")
  .attr("class", "y")
  .attr("x1", 0)
  .attr("x2", 450)
  .attr("y1", y)
  .attr("y2", y)
  .style("stroke", "#ccc");

// Define stock x and y axis
var xAxis = d3.svg.axis().scale(x).orient('top');
var yAxis = d3.svg.axis().scale(y).orient('left');

chart.append('g')
  .attr("class", "axis")
  .call(xAxis);

chart.append('g')
  .attr("class", "axis")
  .call(yAxis);
Here is the complete working example, with css that cleans up the tick marks.
Still not much to see yet, but I’m establishing the foundation on which to build. 🙂
Continue with the D3 Series:
- Learning D3 Part 1: Selections, Properties, Data
- Learning D3 Part 2: Enter and Exit
- Learning D3 Part 3: Animation & Interaction
- Learning D3 Part 4: Intro to SVG Graphics
- Learning D3 Part 5: Axes
- Learning D3 Part 6: Scales & Colors
- Learning D3 Part 7: Choropleth Maps

Thanks Scott for this D3 “Learning” series. It makes for a nice intro. My “ticks” were a solid bar of black when I initially played with the code. So I looked into the Scott Murray tutorial you linked out to, I was able to pull the CSS from there which cleaned it up.
These tutorials are very helpful Scott, thank you! Would you consider adding a link to a page containing just the example?
In case this is helpful to others, here’s the css I pulled from Scott Murrary’s tutorial for cleaning up the tick marks:
.axis line, .axis path {
fill: none;
stroke: #000;
shape-rendering: crispEdges;
}
.axis text {
text-shadow: 0 1px 0 #fff;
cursor: move;
}