Learning D3 Part 1: Selections, Properties, Data
I thought I’d take a stab at learning D3, the JavaScript data visualization library. To start, I picked through some of the examples and tried the code running in my own browser.
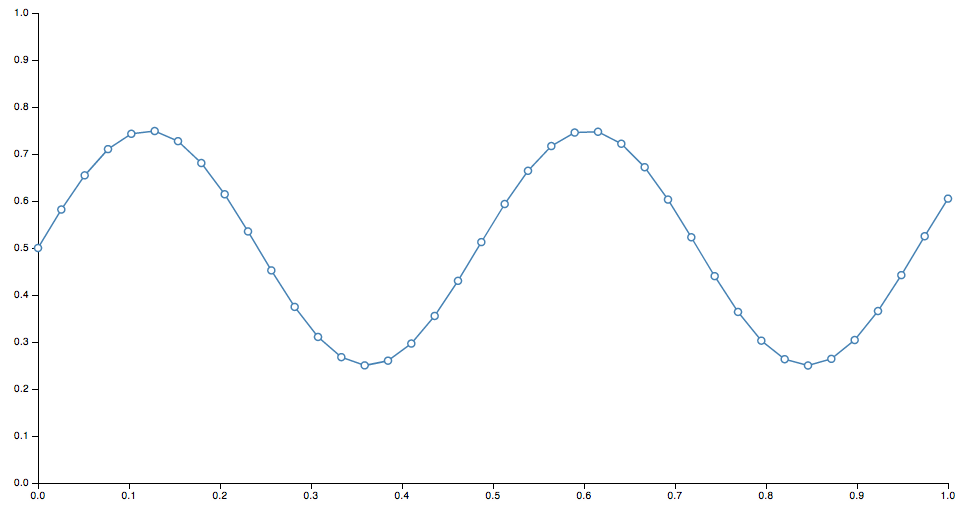
Once I played around with some of the code and saw a sine wave drawn on the screen, modified some values and saw the change, I thought “awesome!”. Then I went back to the website and the info started to actually click. Before I did that, when I tried to read the docs, my eyes just glazed over. If you’ve never played with it before, it might be the same for you. So best thing to do is, play around with the example code – change some numbers, refresh the page, then come back and read the docs afterwards.
D3 is not a high level library where you can feed it some data, and simply get back charts and graphs. Instead, it provides basic, composable building blocks for constructing visualizations.
So, D3 is built around some core principles. Admittedly, this is basically a shortened, cliff-notes regurgitation of some of the concepts outlined in the docs, restated for my own comprehension.
Selections
Selections are essentially the same as jQuery selectors, and defined by the W3C selectors API.
jQuery – select all paragraphs:
$('p')
D3 – select all paragraphs:
d3.selectAll('p')
In this way, D3 is declarative. Instead of manually finding and looping through arrays of DOM nodes, you specify what you want to operate on, then operate on the entire selection at once
Dynamic Properties
Styles, attributes, and other properties of the DOM can be specified as functions of data in D3, as opposed to simple constants.
Set the color style of all paragraphs to a simple value:
d3.selectAll("p").style("color", "white");
Set the color style of all paragraphs to alternating shades of gray:
  d3.selectAll("p").style("color", function(d, i) {
    return i % 2 ? "#fff" : "#eee";
  });
Bound Data
Dynamic, aka computed properties, often refer to data. The .data() method binds data to elements.
You might bind an array of numbers to list items. You can use these to compute dynamic font sizes
  d3.selectAll("li")
    .data([8, 4, 7, 12, 18])
    .style("font-size", function(d) { return d + "px"; });
I’ll continue tomorrow and start to build up some basic visuals with these components.
Continue with the D3 Series:
- Learning D3 Part 1: Selections, Properties, Data
- Learning D3 Part 2: Enter and Exit
- Learning D3 Part 3: Animation & Interaction
- Learning D3 Part 4: Intro to SVG Graphics
- Learning D3 Part 5: Axes
- Learning D3 Part 6: Scales & Colors
- Learning D3 Part 7: Choropleth Maps

The d3 syntax did throw me for a loop in the beginning as well but after getting over that initial learning curve I was quite pleased with the results:
http://www.cedexis.com/country-reports/
Still haven’t been able to dive into animations. Looks like a whole other animal 🙂
If you are doing time-series graphs might checkout richshaw:
http://code.shutterstock.com/rickshaw/
Or backbone-d3 if you are building on top of backbone:
http://drsm79.github.com/Backbone-d3/
Thanks Alex! I’ll check out the links. The Cedexis country reports look great!
d3.select(‘p’) is not select all p. d3.selectAll(‘p’) does it.
[…] https://synthesis.sbecker.net/articles/2012/07/08/learning-d3-part-1 Learning d3 […]