Learning D3 Part 2: Enter and Exit
In Learning D3, Part 1 I went over some basic concepts of D3 – selections, dynamic properties, and bound data. I’m going to pick back up with data binding, and discuss how new data gets on the page.
Enter and Exit
Let’s say you have some data. It’s in the form of an array of numbers. Each of the numbers represent something, perhaps it’s the number of miles you ran each time you’ve gone for a run so far this month:
var distances = [2.23, 2.39, 2.59, 2.77];
So we have four distances. In our first go at this, we’ll bind these to all the paragraphs on the page.
d3.selectAll('p')
  .data(distances);
If we have some paragraphs already in the document, then great, we can go about updating them to represent our data.
d3.selectAll('p')
  .data(distances)
  .text(String) // set the paragraph text to the data values
This is simply passing String as a callback function to text(). String will be called for each of the data items or “datums”. The value returned (the number, converted to a string) is rendered as the text node of the element.
But lets say to begin with, we just have a blank page, with no paragraphs. How do we get new paragraphs on the page, representing the data? Enter .enter(). When we call enter() on an existing selection, we switch to a sub-selection representing the data that is yet to be mapped to an element, because there is not yet enough of them on the page to represent all of the current dataset. In other words, if there are more datums in our dataset than elements on the page, the “enter” sub-selection represents the yet-to-be-added elements.
d3.selectAll('p')
  .data(distances)
  .text(String)
  .enter() // switch to yet-to-be-added elements selection
Following .enter(), we declare how these elements should come into being. Should they appended at the end of the current selection, or inserted at the beginning? In most cases, probably append. Also notice I added .select(‘body’) before selecting all paragraphs. This is there because we need a parent element to append new elements within.
d3.select('body').selectAll('p')
  .data(distances)
  .text(String)
  .enter()
    .append('p') // append a paragraph node for each new datum
    .text(String); // and set its text value
Now, new paragraph elements will be rendered for all datums which don’t yet have a matching paragraph element. D3 also supports the reverse, handling how to remove extra DOM nodes that no longer are needed to represent the entire dataset. In order to do this, you must first set the overall selection to a variable, then call enter and exit on it separately.
// Update existing paragraphs
var p = d3.select('body').selectAll('p')
         .data(distances)
         .text(String);

// Add any new paragraphs needed
p.enter()
  .append('p')
  .text(String);

// Remove any paragraphs no longer needed
p.exit()
  .remove();
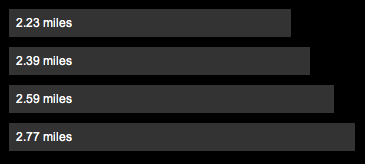
That works, but it’s not much to look at. How easy would it be to convert it into a bar chart? Pretty simple:
  d3.select('body').selectAll('div')
    .data(distances)
    .enter()
      .append('div')
      .style('width', function(d) { return (d * 120) + 'px'; })
      .text(function(d) { return d + ' miles'; });
Here we just switched the selection to all divs on the page. We style the width using a function which multiples the miles datum by a factor of 120 pixels. and we set the text to “{x} miles”. Add a little CSS, and you get something like this:
Here’s a running example you can play with. Try changing the data values, or rendering it in a different way. Bar charts might not be the best way to represent a series of running times.
In tomorrow’s post I’ll go over animated transitions and possibly get into interaction. In the meantime, check out this slick D3-powered visualization of cloud providers from my friend Alex Wenckus at Cedexis.
Continue with the D3 Series:
- Learning D3 Part 1: Selections, Properties, Data
- Learning D3 Part 2: Enter and Exit
- Learning D3 Part 3: Animation & Interaction
- Learning D3 Part 4: Intro to SVG Graphics
- Learning D3 Part 5: Axes
- Learning D3 Part 6: Scales & Colors
- Learning D3 Part 7: Choropleth Maps
