Learning D3 Part 6: Scales & Colors
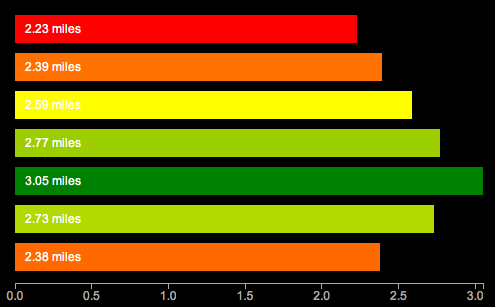
In Learning D3 Part 5, I waxed poetic about D3’s functions for drawing axis lines and labels. This time I’ll talk about scales. Here’s a pretty graph to go with it. This is similar to the earlier examples, but now drawn with SVG, using axes and scales. Ooh la la.
What are scales?
According to the ol’ wikipedia, a scale is “a graduated range of values forming a standard system for measuring or grading something”. In D3 though, scales are functions. “Functions that map from an input domain to an output range”.
In other words, scales are what tell you how many pixels high a bar chart should be with a value of 1 vs 5 vs 7. If you wanted to draw a very tiny bar chart, you could just use those values, and draw bars that are only 1, 5, and 7 pixels high. But if you really want to make your point, you’d probably do better drawing bigger bars.
D3 has some built in scales you can use for convenience. The most common type of scale in D3 is the linear scale.
linear: arranged in or extending along a straight or nearly straight line
scale: a graduated range of values forming a standard system for measuring or grading something
So a linear scale is a scale which the output value increases or decreases in constant proportion to the input value.
The simplest possible scale is a 1:1 scale.
var scale = d3.scale.linear();

scale(1) // 1
scale(2) // 2
Domain
The domain is the range of possible input values in the scale. So I have a series of distances [2.23, 2.39, 2.59, 2.77, 3.05] I might want the domain to range from 0 to 4 or so, to capture the complete range of input values.
Range
The range is the range (again) of possible output values in the scale. Your output values might be in pixels. If you have a 400 pixel wide graph, you’d want to have a range on the x-axis from 0 to 400.
So, just remember domain means input, range means output.
Say we want to draw a very tall bar chart. We might want each input unit to equate to 100 pixels in height. So we’d need a 1:100 scale. Our input values range from 0 to 10, so thats our domain, and our graph is 1000 pixels tall, to accomodate these giant bars, so our output values range from 0 to 1000.
var scale = d3.scale.linear()
  .domain([0, 10])
  .range([0,1000]);

scale(0) // 0
scale(1) // 100
scale(2) // 200
You can also invert them. This is how you get 0 on the bottom of the Y axis with SVG.
var scale = d3.scale.linear()
  .domain([0, 10])
  .range([1000,1]);

scale(0) // 1000 - for the y axis, all the way at the bottom
scale(1) // 900 - a little higher
scale(2) // 800 - even higher now
Linear scales are pretty flexible. You can even use them to create color gradients:
var color = d3.scale.linear()
    .domain([-1, 0, 1])
    .range(["red", "white", "green"]);

color(-1)   // "#ff0000" red
color(-0.5) // "#ff8080" pinkish
color(0)    // "#ffffff" white
color(0.5)  // "#80c080" getting greener
color(0.7)  // "#4da64d" almost there..
color(1)    // "#008000" totally green!
This is a polylinear scale (aka multiple linear scales in one) lifted straight out of the API docs. The input domain from -1 to 0 maps from red to white, and from 0 to 1 maps from white to green. How cool is that? It calculates the color transitions for you.
Other Kinds of Scales
It doesn’t stop at linear. Oh no. So many more to choose from.
identity: a special kind of linear scale, 1:1, good for pixel values. input == output
power and logarithmic scales: sqrt, pow, log – for exponentially increasing values
quantize and quantile scales: for discrete sets of unique possible values for inputs or outputs
ordinal: for non quantitative scales, like names, categories, etc.
Here’s a running example of the graph at the top. I promise to do something other than bar charts of running distances next time. If you need more excitement right now, here’s a randomly generated, animated donut chart. So crazy.
Bonus question – what’s the redundant, non data-ink on the first chart?
Continue with the D3 Series:
- Learning D3 Part 1: Selections, Properties, Data
- Learning D3 Part 2: Enter and Exit
- Learning D3 Part 3: Animation & Interaction
- Learning D3 Part 4: Intro to SVG Graphics
- Learning D3 Part 5: Axes
- Learning D3 Part 6: Scales & Colors
- Learning D3 Part 7: Choropleth Maps

Thanks a lot!! Great tutorial, with nice and simple examples! Exactly what I was looking for :).