Update: I'm releasing a series of screencast tutorials on D3 at deveo.tv. Check it out and let me know what you think!
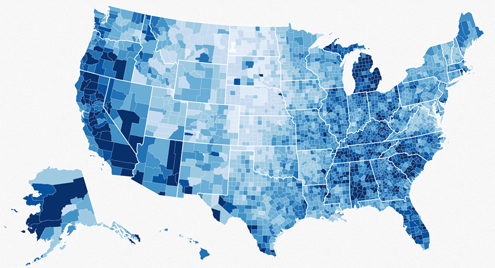 Choropleths are maps that indicate variations in data using different shades of color. Turns out you can easily build these using something like D3. How does that work?
// create a geo path - https://github.com/mbostock/d3/wiki/Geo-Paths
var path = d3.geo.path();

// create an svg element
var svg = d3.select("#chart")
  .append("svg");

// create a container for counties
var counties = svg.append("g")
    .attr("id", "counties")
    .attr("class", "Blues");

// create a container for states
var states = svg.append("g")
    .attr("id", "states");

// load the county shape data
d3.json("../data/us-counties.json", function(json) {
  // create paths for each county using the json data
  // and the geo path generator to draw the shapes
  counties.selectAll("path")
      .data(json.features)
    .enter().append("path")
      .attr("class", data ? quantize : null)
      .attr("d", path);
});

// load the state shape data
d3.json("../data/us-states.json", function(json) {
  // create paths for each state using the json data
  // and the geo path generator to draw the shapes
  states.selectAll("path")
      .data(json.features)
    .enter().append("path")
      .attr("d", path);
});

// load the unemployment by county data
d3.json("unemployment.json", function(json) {
  data = json;

  // for each county, set the css class using the quantize function
  // (an external CSS file contains the css classes for each color in the scheme)
  counties.selectAll("path")
      .attr("class", quantize);
});

// quantize function takes a data point and returns a number
// between 0 and 8, to indicate intensity, the prepends a 'q'
// and appends '-9'
function quantize(d) {
  return "q" + Math.min(8, ~~(data[d.id] * 9 / 12)) + "-9";
}
And the CSS classes for each shade of blue:
.Blues .q0-9 {
  fill: rgb(247, 251, 255);
}
.Blues .q1-9 {
  fill: rgb(222, 235, 247);
}
.Blues .q2-9 {
  fill: rgb(198, 219, 239);
}
.Blues .q3-9 {
  fill: rgb(158, 202, 225);
}
.Blues .q4-9 {
  fill: rgb(107, 174, 214);
}
.Blues .q5-9 {
  fill: rgb(66, 146, 198);
}
.Blues .q6-9 {
  fill: rgb(33, 113, 181);
}
.Blues .q7-9 {
  fill: rgb(8, 81, 156);
}
.Blues .q8-9 {
  fill: rgb(8, 48, 107);
}
Continue with the D3 Series: